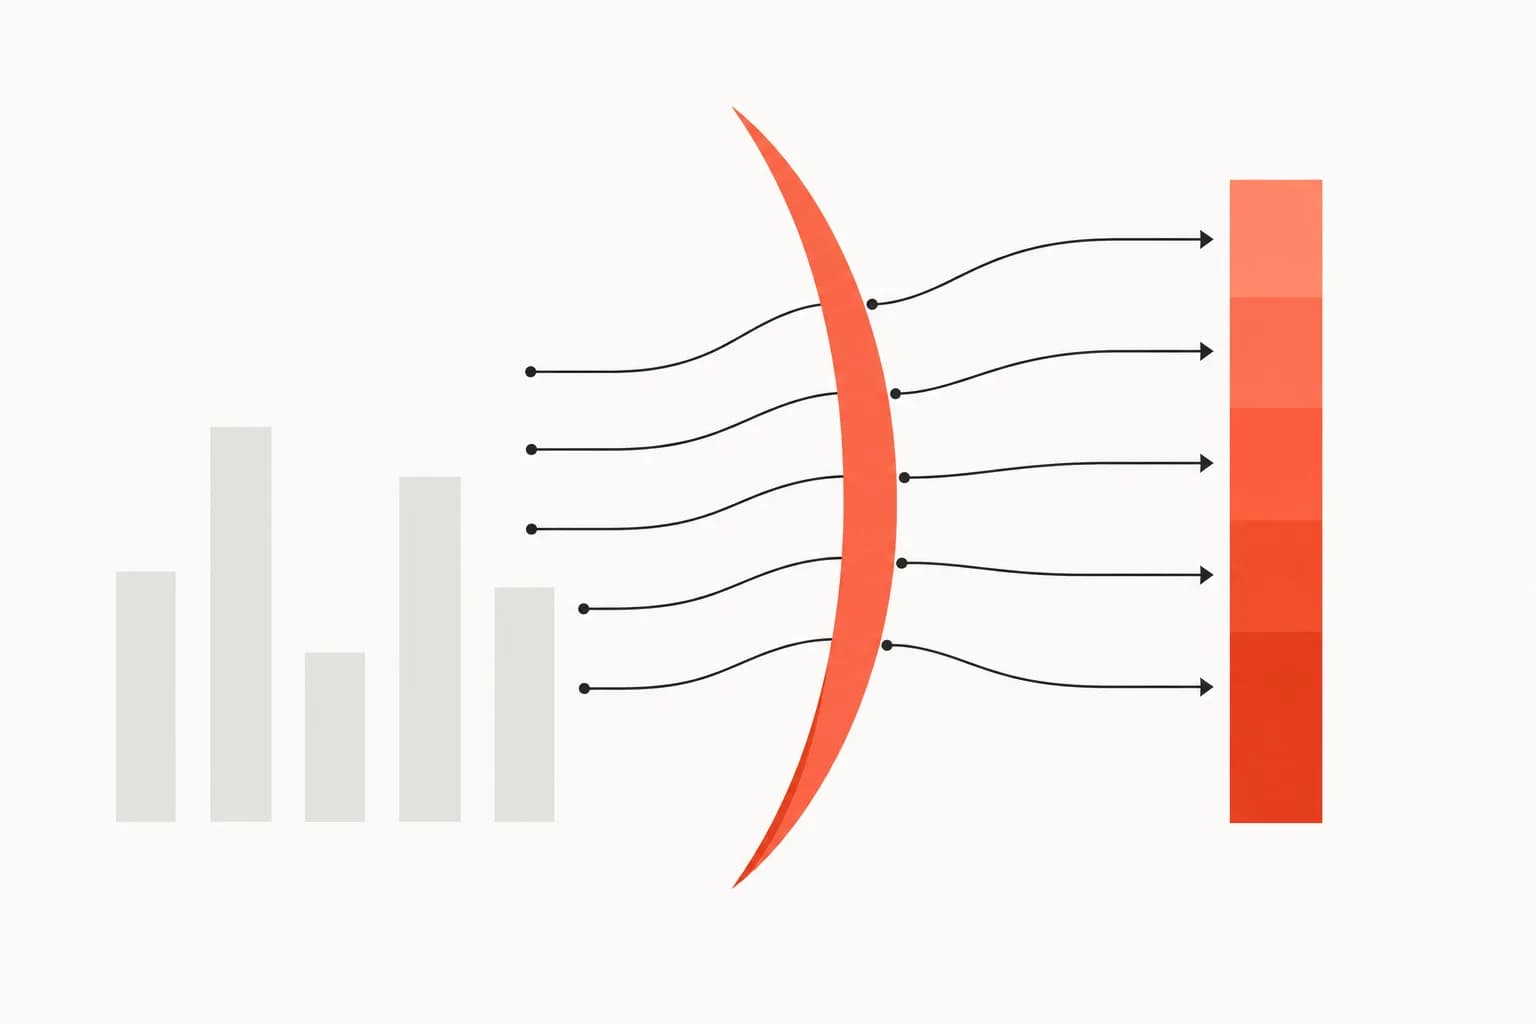
QTAC scales each QCAA subject result, adds the best five into a Tertiary Entrance Aggregate (TEA), then converts that aggregate into an ATAR rank. QCAA produces the subject results; QTAC calculates the scaling, TEA and ATAR.
Almost every other explanation of the ATAR you will hear at school is a rumour about scaling. Chemistry scales up. Art scales down. Pick Specialist Maths and the system rewards you for it. Some of that is half true and some of it is exactly backwards, and the difference matters because subject selection is a decision you make once and live with for two years.
The full method is public. QTAC publishes it in a technical document, and it is not complicated once the stages are separated: your results are scaled, the best five are added together, and the total is turned into a rank. This walks through all three with QTAC's own published figures for the 2025 Year 12 cohort.
Two organisations, and they do different jobs
The single most common confusion is treating QCAA and QTAC as one body. They are separate, and the handover point between them is where scaling happens.
QCAA runs senior assessment. It endorses your task sheets, confirms your school's internal marks, marks the external assessment, and issues your subject result — the mark out of 100 and the A–E for each subject. If you are planning that final instrument, the 2026 QCAA external assessment timetable has every date, session, duration and exam weighting. That process is finished before the ATAR exists, and how a QCAA subject result is built covers it end to end.
QTAC then takes those subject results and calculates the ATAR. Scaling, the aggregate and the rank are entirely QTAC's, overseen each year by a technical committee drawing on QTAC, QCAA and Queensland tertiary institutions. Nothing your school or QCAA does sets your scaling.
Stage one: your result becomes a scaled result
A raw 80 in one subject and a raw 80 in another are not the same achievement, and an ATAR has to compare students who share almost no subjects. Inter-subject scaling is how that comparison is made. Every General subject result is mapped onto a common 0–100 scale before anything is added up.
Here is what that mapping did to a raw 80 in the 2025 cohort.
| Subject | A raw 80 became | Raw needed for a scaled 80 | Students |
|---|---|---|---|
| Specialist Mathematics | 94.5 | 61 | 4,702 |
| Mathematical Methods | 91.9 | 65 | 12,011 |
| Economics | 88.9 | 72 | 4,044 |
| Chemistry | 84.1 | 78 | 9,277 |
| Physics | 81.1 | 79 | 8,239 |
| English | 80.1 | 80 | 27,465 |
| Modern History | 77.0 | 83 | 5,415 |
| Business | 74.5 | 86 | 4,724 |
| Biology | 73.5 | 84 | 13,850 |
| General Mathematics | 71.3 | 90 | 21,015 |
| Psychology | 69.3 | 87 | 5,787 |
| Physical Education | 68.7 | 91 | 5,350 |
| Dance | 53.6 | not reachable | 759 |
That last row is not a typo. On the 2025 curve a perfect raw 100 in Dance scaled to 77.8, so no result in that subject reached a scaled 80 at all. The spread across the table is roughly 41 scaled points for identical raw marks.
What scaling is actually measuring
Look at the table and the obvious story is that harder subjects scale up. That story is wrong, and it is worth being precise about why.
Difficulty is not an input. QTAC never rates a subject's difficulty and no committee assigns it a bonus. The algorithm works from student results alone: it takes each student's percentile rank calculated across everything they studied, fits a relationship between raw results and those ranks for each subject, updates the scaled results, recalculates the ranks, and repeats until the numbers settle.
Specialist Mathematics scales high because the students who choose it tend to be strong across their whole line-up, and the scaling reads that off their other results. This is also why the numbers move every year: a subject's curve is recalculated from each new cohort, so the 2025 figures above describe 2025 and are a guide rather than a promise for any other year.
Scaling is a curve, not a bonus
The other half of the rumour is that a subject scales you up or down by some fixed amount. It does not. Each subject has its own S-shaped curve, and the same subject can move you down at one end and up at the other.
| Raw result | Chemistry | English | General Mathematics |
|---|---|---|---|
| 50 | 14.8 | 34.6 | 37.4 |
| 60 | 35.2 | 51.0 | 49.0 |
| 70 | 62.9 | 67.2 | 60.7 |
| 80 | 84.1 | 80.1 | 71.3 |
| 90 | 94.3 | 88.8 | 79.9 |
| 100 | 98.1 | 94.0 | 86.5 |
Chemistry is the clearest case. A raw 60 fell to 35.2, a loss of nearly 25 points, while a raw 90 rose to 94.3. The subject that "scales up" scaled most of its cohort down. The steepness through the middle is the real story: between raw 60 and raw 80, Chemistry moved 49 scaled points, so a few extra raw marks in that band were worth far more than the same marks at either extreme.
Stage two: your best five become a TEA
Scaled results are added into a Tertiary Entrance Aggregate. The TEA is the sum of your best five scaled results, so it runs from 0 to 500, and it is the number you are ranked on.
Which five is not your choice, and not your school's. QTAC tests every combination you are allowed and keeps whichever gives the highest total, under three schemes.
- Five General subjects at Units 3 and 4.
- Four General subjects plus one Applied subject at Units 3 and 4.
- Four General subjects plus one completed VET qualification at AQF Certificate III or higher.
Three rules narrow the field. You can count General English subjects or Applied English, not both. The same applies to General mathematics and Essential Mathematics. And where a subject is taken both as a General subject and through the Senior External Examination, only one result counts.
A worked aggregate
Take a student sitting English, Biology, Chemistry, General Mathematics and Modern History, on the 2025 curves.
| Subject | Raw result | Scaled result |
|---|---|---|
| English | 82 | 82.21 |
| Chemistry | 75 | 75.01 |
| General Mathematics | 80 | 71.26 |
| Biology | 78 | 69.75 |
| Modern History | 74 | 68.96 |
| TEA | 367.19 |
Their raw marks average 77.8. Their scaled results average 73.4. Both facts are ordinary, and neither tells you the ATAR on its own — for that the aggregate has to be ranked.
Stage three: your TEA becomes a rank
The ATAR is a rank, not a score. It reports your position relative to the potential Year 12 population, expressed on a 2000-point scale from 99.95 down to 0.00 in steps of 0.05. Anything at or below 30 is reported as "30.00 or less".
The phrase "potential Year 12 population" is doing real work. Your rank is not calculated against the students who received an ATAR. QTAC builds a notional cohort from Australian Bureau of Statistics population projections for Queensland residents aged 16 to 20, weighted by the age profile of ATAR-eligible students. In 2025, 30,167 students were ATAR-eligible out of a scaling cohort of 59,919 — and the ranking base is larger still. That is what keeps a Queensland ATAR comparable with an ATAR from another state, and why an ATAR of 80 does not mean you beat 80 per cent of the people in your year level.
For the worked aggregate above, a TEA of 367.19 landed at an ATAR of about 82.
What this actually means for choosing subjects
The scaling table is the most screenshotted thing in Queensland senior schooling and the most misused. The trap is reading it as a menu, as though moving from Physical Education into Specialist Mathematics converts a raw 80 from 68.7 into 94.5.
It does not, because the raw 80 does not travel with you. Specialist Mathematics scales as it does precisely because its cohort is strong, and joining a stronger cohort moves your position inside it down. The scaling has already priced in the thing you were hoping to arbitrage.
What the curves do justify is narrower and more useful. Steepness tells you where marks are worth most: in a subject like Chemistry, the stretch between raw 60 and raw 80 carries far more scaled value than the stretch above 90, so effort aimed at the middle of that range pays more than polishing an already strong result. And a subject you will actually work at will out-earn a higher-scaling subject you resent, every time, because raw result is the only input to this whole machine that you control.
Key takeaways
| Point | Details |
|---|---|
| Two bodies, two jobs | QCAA issues subject results. QTAC scales them, aggregates them and calculates the ATAR. |
| Scaling measures cohorts, not difficulty | A subject scales high when its students perform well across all their subjects. Difficulty is never an input. |
| It is a curve | The same subject can scale a low result down and a high result up. Chemistry moved a raw 60 to 35.2 and a raw 90 to 94.3 in 2025. |
| The TEA is your best five | Five General, or four General plus one Applied or a Certificate III+ VET qualification. QTAC picks the combination that scores highest. |
| English is eligibility, not a guaranteed slot | One English subject at C or better is required; the result itself only counts if it makes your best five. |
| The ATAR is a rank | Position against the potential Year 12 population on a 2000-point scale, 99.95 to 0.00, with 30.00 as the reporting floor. |
| Scaling is recalculated annually | Every figure here describes the 2025 cohort. Next year's curves will differ. |
The year I picked a subject for the wrong reason
I chose a subject in Year 11 almost entirely because someone showed me a scaling table at a lunch table. Not because I was interested in it, and not because I was any good at it — because the number next to it was high. I spent two years being comprehensively out-worked by people who had chosen it on purpose, and the scaled result I eventually got was worse than what I would have earned somewhere I actually wanted to be.
The mistake was not reading the table. It was reading it as a list of rewards rather than a description of who else was in the room. Scaling is a photograph of a cohort. Walking into a stronger photograph does not make you taller.
The version of this I wish someone had said out loud: the only number in the entire calculation you can move is the raw result, and you move it by doing the work in front of you well. Everything after that is arithmetic performed by an organisation you will never speak to.
See what your results turn into
Reading the method is one thing and seeing your own subjects run through it is another. The Queensland ATAR calculator applies the scaling curves described here to the results you expect, shows the scaled result for each subject, adds your best five into a TEA, and estimates the ATAR that aggregate reaches. It applies the eligibility schemes and precluded combinations too, so it will tell you when a result cannot count.
Working backwards from a target is the useful direction. If your estimate sits below where you want it, the lever is a raw subject result, and a raw subject result is decided by internal assessment you can still improve. You can check a draft against your ISMG before you submit and see criterion by criterion where the marks are sitting, which is the only stage of this process where anything is still moving.
The figures throughout come from QTAC's ATAR Report 2025 and the technical document Calculating the ATAR in Queensland.
Recommended
- how to choose Year 11 subjects: QCE credits, ATAR eligibility and the SET plan
- how your QCAA subject result is built from IA1, IA2, IA3 and the exam
- the Queensland ATAR calculator
- the GPA calculator, for your report card on the 15-point scale
- the QCAA senior assessment glossary
- how to move your draft up one mark band